For this lab, the goal was to develop a unique coordinate system for a 1m x 1m custom sandbox landscape and log elevations to understand sampling techniques. Sampling can be used in many fields of science, but for the purposes of this lab, and within spatial sciences as a whole, it was used to gain a general survey of a particular geography's landscape. There are many different sampling methods to choose from. The most common being: random, systematic, and stratified- each containing advantages and disadvantages.
Random sampling limits bias by taking random samples from a line, area, or choosing a random point.
Systematic sampling limits bias by using a consistent and methodical interval for sampling.
Stratified sampling breaks down the sample population into various groups, which attempts to refine the entire sample and best represent the sample population.
For this exercise, my group decided to use two systematic sampling methods.
Methods
Once the landscape of the sandbox was created and all the required terrain features were formed, my group and I had to develop a coordinate system to aid in our elevation sampling of the landscape. The coordinate system was made by using thumb tacks and string to make a grid across the top of the sandbox. Our coordinate system contained 10 cm intervals with the point of origin being the northwest corner of the sandbox.
 |
| Figure 1: Jake (left), Bayli (not pictured), and I (right) with our sandbox landscape. |
 |
| Figure 2: View of sandbox from Jake and I's perspective in Figure 1. Cardinal directions shown in yellow. |
Our systematic approaches to sampling were as follows: measure elevation (Z) of landscape at each (X,Y) vertex, and measure Z values that intersect with X coordinates along a line from (0,1) to (8,0). Elevation was measured with a meter stick and logged as cm below our coordinate system (a string grid). My partners recorded values while I measured elevations of the vertices, starting at (0,0) going up the length of the Y-axis, then resuming at (1,0) and so on. A field book table and excel document were used to record values at the same time to ensure accuracy of the measurements.
 |
| Figure 3: Our string and thumbtack coordinate system. Areas crossed out in red were unused due to the size of our coordinate intervals. |
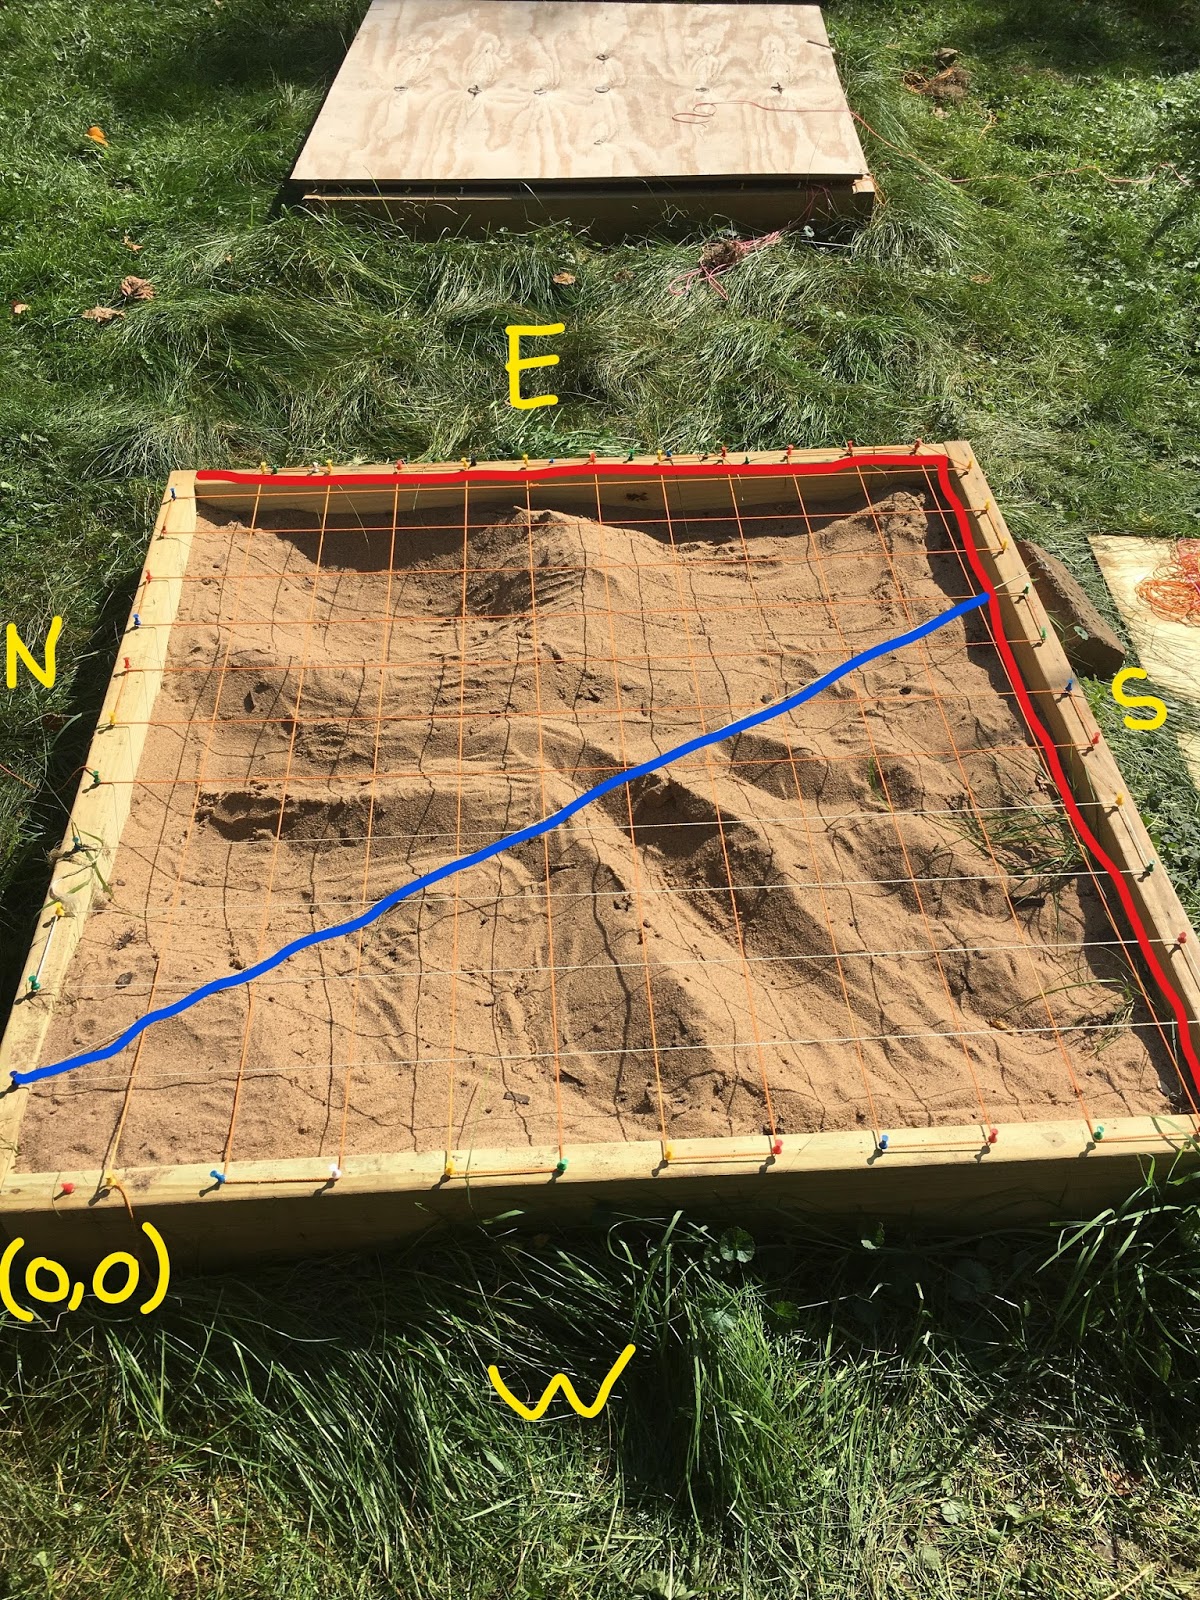 |
| Figure 4: View of coordinate system with cross section line shown in blue. Red lines show the extent of the area surveyed. |
Results
In total, we recorded 121 points with the systematic grid sampling method and 8 points with the cross section sampling method. The lowest point sampled was 14.4 cm below the grid and the highest point sampled was 0.4 cm below the grid. Overall the mean value was 6.2 cm below the grid.
We didn't run into any major problems, other than a few mix-ups with Z-values- to which we would just start the column over and re-measure.
Conclusion
While sometimes not extremely precise or representative, sampling can provide insightful information about a particular population in an efficient manner. In terms of a spacial application to sampling, it could be useful for getting a sense of general landscape characteristics or species abundance in an area. For spatial applications that require more precision, like geomorphology or sedimentology, sampling might not be the best solution.
No comments:
Post a Comment